App Description
See Code |
Help conserve server resources by running the code yourself! | |
Launch App |
Don't know R? No problem! Run it on our servers! |
As scientists search for new insights into the world of work, topics inevitably fall in and out of vogue. Perhaps the most volatile and well recognized swings in research interests have been observed in personality research. Walter Mischel’s 1968 book Personality and Assessment came to the gloomy conclusion that “[w]ith the possible exception of intelligence, highly generalized behavioral consistencies have not been demonstrated, and the concept of personality traits as broad response predispositions is thus untenable.” After this book was published, personality research for selection and assessment slowed considerably until about a decade later. Identifying these trends (and slumps) can help researchers and practitioners see where the field is headed, where it has been, and identify ideas and topics that should be brought to light once again.
This app was designed to help researchers and practitioners identify current trends in industrial-organizational psychology. It uses user-defined queries to search article abstracts in I-O psychology’s top scientific journals. Search results are plotted over time, and users have the option to focus on specific (or all) journals, and download a .csv file of their generated data. Additionally, search results are used to predict citation rates across the decades. Feel free to download and adapt the app to your needs, or submit a request and we will see if we can help.
Dashboard
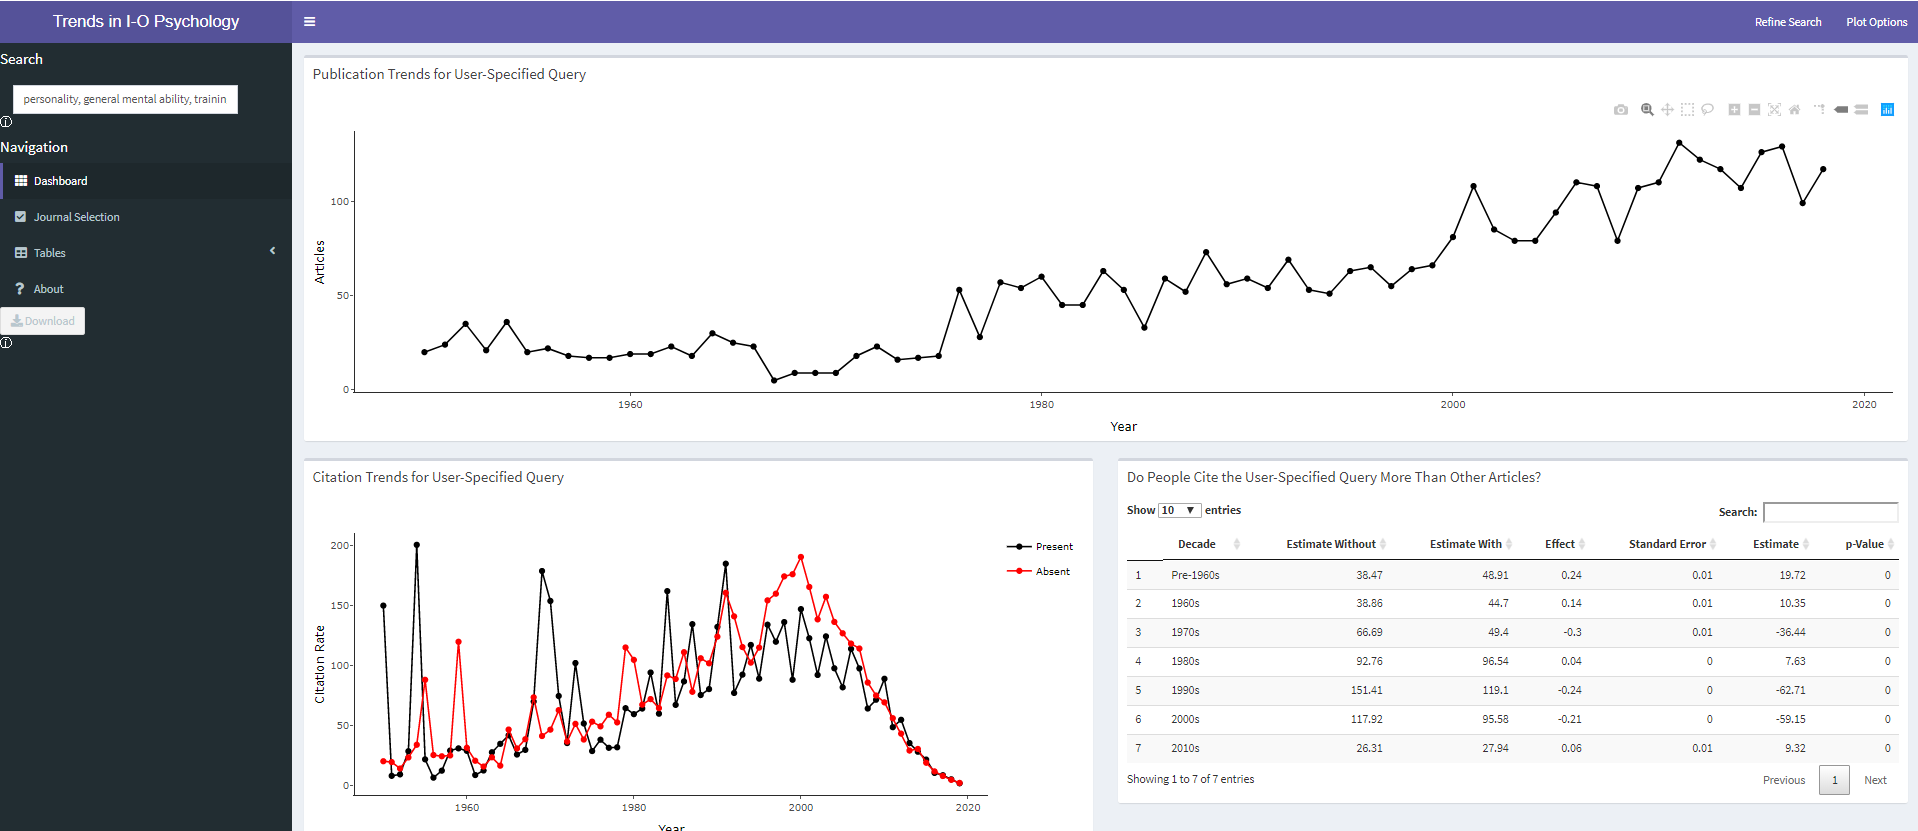
The primary dashboard is composed of three panes. The first and largest contains an interactive plot that depicts the number of articles that match the user query across time. Users can chose to plot their search results as a raw frequency or as a proportion. For greater insight, users plot separate lines for each journal.
The second pane plots the citation trends across time. Two lines are plotted. The black line depicts the citation trends for articles that match the user specified query while the red line depicts the citation trends for those that did not match.
The final plot reports the results of a by decade poisson regression. The column "Estimate With" reports the predicted citation count of articles matching the user's query. The column "Estimate Without" reports the predicted citation count of articles not matching the user's query. The reported p-value tests the null that articles matching the user's query are cited as frequently as articles not matching the user's query. Given the large sample size, it is unlikely that the null will fail to be rejected very often. I would recommend relying on effect size to interpret the results.
Journal Selection

Our database has contains information on a ton of journals, likely more than the average user has need for. The "Journal Selection" page allows users to select which journals are included in the analysis. This allows each person to refine their search based on their needs.
Search Results
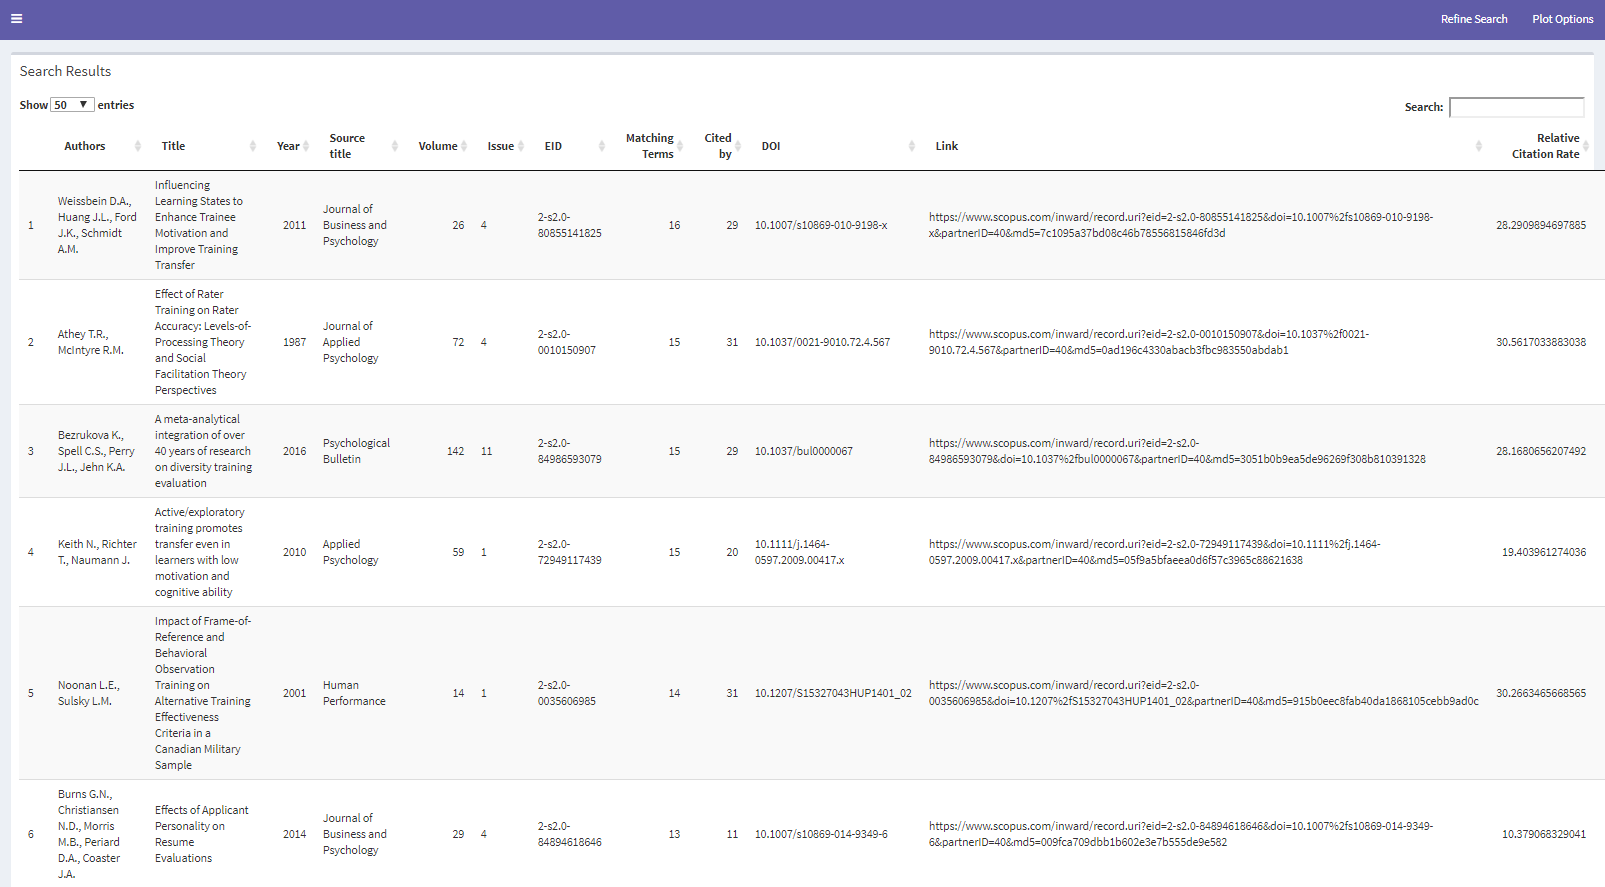
Users can explore their search results by navigating to "Search Results" in the tables drop down menu. This table can be downloaded as a csv file and stored for later use.