App Description
See Code |
Help conserve server resources by running the code yourself! | |
Launch App |
Don't know R? No problem! Run it on our servers! |
Whether developing a selection system or creating a new performance metric, validation studies provide evidence that our measures 1) are measuring what we think they are measuring and 2) actually serve a business necessity. In a perfect world, we would have unlimited resources to collect a massive sample. In reality, we often need to allocate our resources in an effective manner.
This app's primary purpose is to help practitioners determine whether collecting more observations for their validation study is worth the investment. This, of course, should be determined on a case by case basis considering the intent of the validation and organizational objectives. However, some metrics can help practitioners make an informed decision.
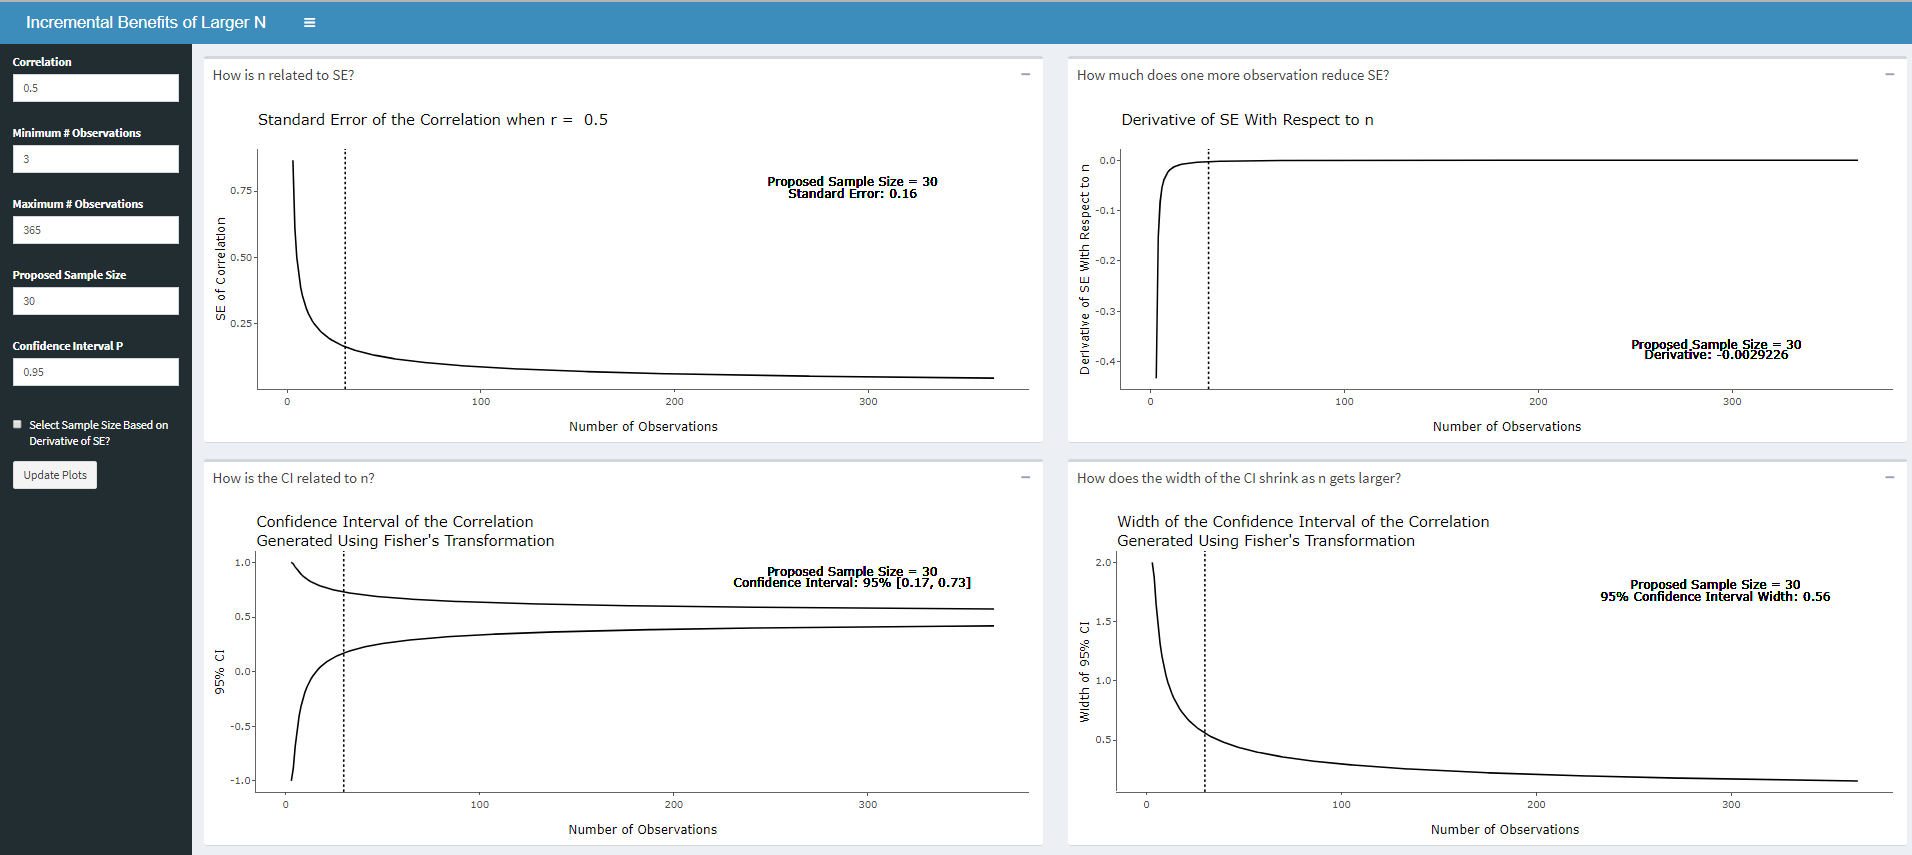
The dashboard provides four plots that illustrate how sample size influences the precision of your estimate for a correlation coefficient. The first illustrates standard error across different sample sizes. Simply put, the standard error is an estimate of how uncertain we are about the estimated correlation. Smaller values of standard errors are considered better in the context of the validation because they suggest that our estimate is more precise. You may notice that as sample size increases the incremental benefits of additional observations decrease. In other words, at a certain point, collecting additional observations may not be worth your time!
The standard error plot may provide some insight into what sample size is "enough" is "enough". However, the standard error is difficult to interpret in and of itself. The app provides to additional visualizations related to precision. These relate to the confidence interval for the correlation. The bottom left plot visualizes the confidence interval across sample sizes while the bottom right plot illustrates how the width of the CI changes across sample sizes. These really offer different perspectives on a similar phenomenon. In the context of validation studies, narrower confidence intervals are better as they indicate a narrower plausible range of values for the correlation given the data. However, as the sample size increases the relative benefit of more data in reducing this width of the confidence interval decreases. This confidence interval is generated using Fisher's r-to-z transformation (see here) and offers a slightly different perspective than the standard error of the correlation.
Finally, in an attempt to make the incremental benefit of collecting additional observation's explicit, the app estimates and plots the derivative of the standard error with respect to the sample size. Roughly speaking, the derivative is the incremental reduction in standard error for collecting one additional observation. In actuality, it will always be an over estimate. For small sample sizes, the derivative is much higher than for larger sample sizes.
How can the derivative of the standard error be used? The derivative could be a useful way to set stopping points for validation studies while conserving resources. In other words, researchers could collect data until the derivative is sufficiently small, meaning that the incremental precision attained by collecting one more observation is not worth the time and resources invested to collect that data. The value to set as the stopping criteria should of course be determined by the specific needs of the validation study. However, this method could help balance real-world costs with scientific rigor.
While there are many other elements to take into account when conducting validation studies, hopefully this tool can help practitioners and researchers deploy their resources efficiently.